Tuesday, May 29, 2018

FTSE 100 faces worst day in 2 months, engulfed by European political fears

U.K. stocks sold off Tuesday, dragged down alongside European equities, as investors fretted about political risk in Italy and Spain.

What markets are doing

The FTSE 100 index UKX, -1.36% �fell 1.5% to 7,616.75, as fewer than 10 components moved higher. The London blue-chip benchmark is facing its sharpest decline since mid-March, according to FactSet data.

Trading was closed Monday for the Bank Holiday. The index on Friday rose 0.2%, trimming last week��s loss to 0.6%.

The pound GBPUSD, -0.4357% bought $1.3225, down from $1.3312 on Monday in New York.

What��s driving the market

Investors in U.K. and continental European assets ditched equities as they watched political wrangling among major political parties in Italy and Spain. The upheaval was reviving concerns that a significant shift in the political landscapes of both countries could fracture the European Union and the euro. Benchmarks in Italy I945, -2.60% � and in Spain IBEX, -2.37% �were each down roughly 3% on Tuesday.

In Italy, worries grew that the country will be forced to hold a new general election. The country��s president, Sergio Mattarella, on Monday blocked two antiestablishment parties from taking power by rejecting their euroskeptic candidate for economy minister. The populist 5 Star Movement and League parties are now calling for new elections.

Read: Here��s why markets are worried about Italian politics �� again

Also check out: 4 ways the ECB is preventing an Italian rerun of the euro crisis �� for now

In Spain, Prime Minister Mariano Rajoy will face a no-confidence vote in parliament on Friday, which could lead to the ouster of his minority center-right government and its replacement by the Socialist Party. The center-left opposition party called for the vote after a corruption case ended in convictions for senior members of Rajoy��s Popular Party.

What strategists are saying

��Italy��s unsettled domestic politics was spilling into the London market after three days of rest,�� said Fiona Cincotta, senior market analyst at City Index, in a note.

��The euro was looking frail, trading at a 6-month and heading lower against major currencies as Italy��s domestic strife cast a dark cloud over Italy��s relations with the European Union. The pound is not in a much better shape this morning, dropping to multimonth lows against the dollar, yen and the Swiss franc,�� she added.

Stock movers

Royal Bank of Scotland Group PLC RBS, -3.45% �lost 3.6% following a Sky News report that the U.K. government is preparing to sell a multibillion-pound stake in the lender, possibly as soon as this week.

Off the main benchmark, Dixons Carphone PLC DC., -20.33% �tumbled 22% after the British electronics and phones retailer issued a pretax profit warning for fiscal 2019.

Copper miner Fresnillo PLC FRES, +2.50% �rose 3.5%, topping the FTSE 100��s few advancers.

Carla Mozee

Carla Moz茅e is a reporter for MarketWatch, based in London. Follow her on Twitter @MWMozee.

We Want to Hear from You

Join the conversation

Comment Related Topics United Kingdom London Stock Exchange London Markets Bank of England Europe European Markets Quote References UKX -105.32 -1.36% GBPUSD -0.0058 -0.4357% I945 -570.57 -2.60% IBEX -231.90 -2.37% RBS -10.00 -3.45% DC. -47.45 -20.33% FRES +32.50 +2.50% Show all references MarketWatch Partner Center

Sunday, May 27, 2018

Crusader Energy Group (JONE) Reaches New 52-Week High and Low at $0.44

Crusader Energy Group, LLC (NYSE:JONE)’s share price hit a new 52-week high and low during mid-day trading on Friday . The company traded as low as $0.44 and last traded at $0.50, with a volume of 22608 shares changing hands. The stock had previously closed at $0.52.

A number of equities analysts have issued reports on the company. Zacks Investment Research lowered Crusader Energy Group from a “hold” rating to a “sell” rating in a research note on Tuesday, January 30th. ValuEngine lowered Crusader Energy Group from a “sell” rating to a “strong sell” rating in a research note on Saturday, February 3rd. Finally, Stephens reaffirmed a “hold” rating and set a $1.00 price target on shares of Crusader Energy Group in a research note on Thursday, March 15th. Three investment analysts have rated the stock with a sell rating and four have assigned a hold rating to the company. The company has a consensus rating of “Hold” and an average target price of $1.21.

Get Crusader Energy Group alerts:

The company has a debt-to-equity ratio of 1.79, a quick ratio of 1.69 and a current ratio of 1.69.

Crusader Energy Group (NYSE:JONE) last released its quarterly earnings data on Wednesday, May 2nd. The oil and gas producer reported ($0.32) earnings per share for the quarter, missing the consensus estimate of ($0.24) by ($0.08). The company had revenue of $57.49 million for the quarter, compared to the consensus estimate of $54.23 million. Crusader Energy Group had a negative return on equity of 9.77% and a negative net margin of 64.68%. equities research analysts forecast that Crusader Energy Group, LLC will post -1.12 EPS for the current year.

Several institutional investors and hedge funds have recently added to or reduced their stakes in JONE. Marathon Asset Management LP bought a new stake in shares of Crusader Energy Group during the 1st quarter worth $1,430,000. Brookfield Asset Management Inc. boosted its stake in shares of Crusader Energy Group by 57.6% during the 4th quarter. Brookfield Asset Management Inc. now owns 2,400,000 shares of the oil and gas producer’s stock worth $2,640,000 after acquiring an additional 877,268 shares in the last quarter. Cambrian Capital Limited Partnership bought a new stake in shares of Crusader Energy Group during the 4th quarter worth $714,000. California Public Employees Retirement System boosted its stake in shares of Crusader Energy Group by 46.1% during the 4th quarter. California Public Employees Retirement System now owns 790,881 shares of the oil and gas producer’s stock worth $870,000 after acquiring an additional 249,561 shares in the last quarter. Finally, Bank of Montreal Can boosted its stake in shares of Crusader Energy Group by 8,977.4% during the 4th quarter. Bank of Montreal Can now owns 232,562 shares of the oil and gas producer’s stock worth $256,000 after acquiring an additional 230,000 shares in the last quarter. 59.77% of the stock is owned by institutional investors and hedge funds.

Crusader Energy Group Company Profile

Jones Energy, Inc, an independent oil and gas company, engages in the acquisition, exploration, development, and production of oil and natural gas properties in the mid-continent United States. It owns leasehold interests in oil and natural gas producing properties, as well as in undeveloped acreage located in the Anadarko Basin in Oklahoma and Texas.

Saturday, May 26, 2018

BlackRock, Inc. (BLK) Position Boosted by First Republic Investment Management Inc.

First Republic Investment Management Inc. lifted its stake in BlackRock, Inc. (NYSE:BLK) by 2.7% in the first quarter, according to its most recent filing with the Securities & Exchange Commission. The firm owned 63,290 shares of the asset manager’s stock after purchasing an additional 1,667 shares during the quarter. First Republic Investment Management Inc.’s holdings in BlackRock were worth $34,285,000 as of its most recent filing with the Securities & Exchange Commission.

Several other large investors also recently added to or reduced their stakes in the stock. Morningstar Investment Services LLC boosted its position in shares of BlackRock by 9.8% in the 1st quarter. Morningstar Investment Services LLC now owns 36,520 shares of the asset manager’s stock valued at $19,784,000 after purchasing an additional 3,267 shares during the period. Natixis Advisors L.P. boosted its position in shares of BlackRock by 7.1% in the 1st quarter. Natixis Advisors L.P. now owns 28,825 shares of the asset manager’s stock valued at $15,615,000 after purchasing an additional 1,913 shares during the period. Covington Investment Advisors Inc. acquired a new position in shares of BlackRock in the 1st quarter valued at $5,566,000. Stratos Wealth Partners LTD. boosted its position in shares of BlackRock by 8.2% in the 1st quarter. Stratos Wealth Partners LTD. now owns 1,498 shares of the asset manager’s stock valued at $812,000 after purchasing an additional 114 shares during the period. Finally, Providence Capital Advisors LLC boosted its position in shares of BlackRock by 4.8% in the 1st quarter. Providence Capital Advisors LLC now owns 4,033 shares of the asset manager’s stock valued at $2,185,000 after purchasing an additional 183 shares during the period. Institutional investors and hedge funds own 83.36% of the company’s stock.

Get BlackRock alerts:

A number of equities analysts recently weighed in on the company. Deutsche Bank decreased their price target on BlackRock from $623.00 to $614.00 and set a “buy” rating for the company in a research report on Friday, April 6th. JPMorgan Chase & Co. restated an “overweight” rating and set a $640.00 price objective on shares of BlackRock in a research report on Wednesday, March 14th. Zacks Investment Research lowered BlackRock from a “buy” rating to a “hold” rating in a research report on Tuesday, March 13th. ValuEngine lowered BlackRock from a “buy” rating to a “hold” rating in a research report on Wednesday, March 7th. Finally, Credit Suisse Group raised their price objective on BlackRock from $672.00 to $678.00 and gave the stock an “outperform” rating in a research report on Thursday, April 5th. Seven investment analysts have rated the stock with a hold rating and eight have issued a buy rating to the company’s stock. The company presently has an average rating of “Buy” and a consensus target price of $566.62.

Shares of BlackRock opened at $539.61 on Friday, according to MarketBeat Ratings. BlackRock, Inc. has a one year low of $403.12 and a one year high of $594.52. The stock has a market cap of $86.62 billion, a price-to-earnings ratio of 22.44, a price-to-earnings-growth ratio of 1.63 and a beta of 1.67. The company has a debt-to-equity ratio of 1.02, a current ratio of 3.96 and a quick ratio of 3.96.

BlackRock (NYSE:BLK) last announced its quarterly earnings results on Thursday, April 12th. The asset manager reported $6.70 earnings per share (EPS) for the quarter, beating the Thomson Reuters’ consensus estimate of $6.39 by $0.31. The business had revenue of $3.58 billion during the quarter, compared to analyst estimates of $3.43 billion. BlackRock had a return on equity of 12.76% and a net margin of 39.22%. The firm’s revenue was up 15.9% on a year-over-year basis. During the same period in the previous year, the company earned $5.25 EPS. equities analysts expect that BlackRock, Inc. will post 28.05 EPS for the current year.

The company also recently declared a quarterly dividend, which will be paid on Thursday, June 21st. Stockholders of record on Thursday, June 7th will be issued a dividend of $2.88 per share. The ex-dividend date of this dividend is Wednesday, June 6th. This represents a $11.52 annualized dividend and a dividend yield of 2.13%. BlackRock’s dividend payout ratio is 50.97%.

In other news, insider Marc D. Comerchero sold 400 shares of BlackRock stock in a transaction dated Wednesday, April 18th. The stock was sold at an average price of $524.84, for a total transaction of $209,936.00. The sale was disclosed in a document filed with the Securities & Exchange Commission, which is available through this link. Also, insider Jeff A. Smith sold 500 shares of BlackRock stock in a transaction dated Tuesday, April 24th. The shares were sold at an average price of $515.84, for a total value of $257,920.00. The disclosure for this sale can be found here. Over the last quarter, insiders have sold 6,066 shares of company stock valued at $3,348,514. 1.86% of the stock is owned by corporate insiders.

About BlackRock

BlackRock, Inc is a publicly owned investment manager. The firm primarily provides its services to institutional, intermediary, and individual investors including corporate, public, union, and industry pension plans, insurance companies, third-party mutual funds, endowments, public institutions, governments, foundations, charities, sovereign wealth funds, corporations, official institutions, and banks.

Institutional Ownership by Quarter for BlackRock (NYSE:BLK)

Friday, May 25, 2018

Wells Fargo: Only Buy On Weakness

Since the financial crisis, Wells Fargo (NYSE:WFC) performed better than most major banks until recently. Due to the strength of its deposit franchise, its superior cross-selling and its control of costs and risk, the bank demonstrated superior performance and shareholder returns. This was evident in most of the key measures of underlying profitability and in its competitive position in the markets in which it chose to compete and with the clients it chose to serve. Wells Fargo demonstrated more consistent earnings since the financial crisis as a result of its business mix which is less exposed to volatile capital markets and investment banking income. Until recently it did not suffer the same magnitude of legal and/or market-related setbacks as most other major banks. Its management was perceived as being superior. Consequently, Wells Fargo traded at a premium valuation to its peers.

In recent months, as a result of the accounts opening scandal and other sales-related problems, which have been written about in much detail elsewhere, Wells Fargo's relative financial performance has deteriorated and so its premium valuation has unwound. Its stock has significantly underperformed in recent months.
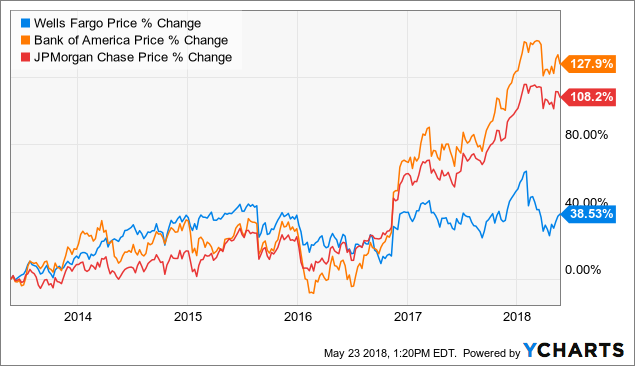
Chart WFC data by YCharts

Chart 
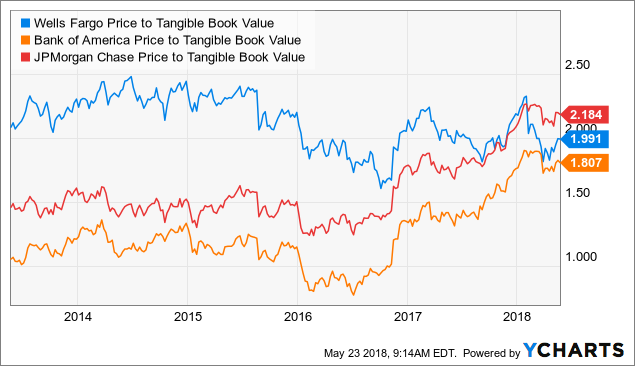
WFC Price to Tangible Book Value data by YCharts

Recent Results

The loss of momentum is very evident in Wells Fargo's results. In Q1 2018, its loans and deposits grew by less than the other majors and its total revenues fell 1.4% year on year versus increases of 4% at Bank of America (NYSE:BAC) and 10% at JPMorgan (NYSE:JPM). Net interest and non interest income both fell. Expense performance deteriorated as a result of the substantial increase in compliance and legal costs (US$3.25bn in Q4 17 and a US$800mm litigation accrual in Q1 2018 in connection with the CFPB and OCC consent orders of April 20, 2018). Costs were an area where Wells Fargo used to be best in class. Its revised efficiency ratio as per its 10-Q was 69% in Q1 2018 versus 60% at Bank of America (the big improver) and 56% at JPMorgan (the best in class).

All of this has led to a loss of momentum in Wells Fargo's Pre Provision Profitability ("PPP") and in its Pre-tax Margin. PPP is a metric which prior management often cited as a key measure of its underlying profitability. Wells Fargo's PPP fell 19% in Q1 vs. Q1 2017 in contrast with the significant growth seen at most other major US banks. Its net income in Q1 2018 fell 9% year on year, despite the positive impacts of the Tax Cuts and Jobs Act and a 68% decline in provisions for credit losses as a result of further legal charges. This was in contrast to the improvements seen at most of the other majors (for example net income increased 34% year on year at Bank of America and 35% at JPMorgan). Wells Fargo started from a better position but has underperformed very significantly in recent months. It no longer has a class-leading Return of Assets or Return on Tangible Equity (two key metrics for our valuation framework), and the movement in both of these key metrics has been in the wrong direction in contrast with the others despite a generally favourable operating environment.

Focus on the Trend in Underlying Profitability

The immediate call to make on Wells Fargo is whether its underlying profitability will return to past levels after the various fines are paid, corrective steps are taken and the bank returns to its underlying operating model. Or has Wells Fargo's historically superior underlying profitability been permanently damaged as a result of the recent events, the reputational damage it has suffered and its prior business model being irreversibly changed by the series of restitution measures it has had to take and no doubt will be required to take going forward?

It is very difficult to answer this question at this moment without being an insider and/or without having direct access to the bank's leadership and management. Nevertheless, Wells Fargo has outlined some of its thinking in its recent Investor Day Presentations.

In the Short Term, Expenses are the Key to Improvement

Net interest income is expected to be stable in 2018 as the positive impact of projected higher interest rates is offset by a possible flattening of the yield curve, hedge unwind costs, expected increases in deposit costs and lower earning assets, partly as a result of the asset cap. The bank has sought to reduce its exposure to some higher risk segments (sensible given the stage of the economic cycle), and this may compress loan yields. Tighter credit spreads may also put pressure on commercial loan pricing, although this may reverse given the spread widening of recent weeks. The bank has forecast that the earnings impact of the asset cap is expected to be less than US$100mm, but we still expect that the bank's growth in net interest income will underperform its peers in the short term. Even if rates were to rise, Wells Fargo is less sensitive to this than others. A 100bp upward shock in interest rates is forecast to result in a 3-5% improvement in net interest income in the first 12 months (+US$1.5-2.5bn improvement using 2017 numbers).

So in the short term, expenses are likely to be the key to improvement. The bank has forecast US$4bn of cumulative expense savings by end 2019 excluding legal costs. Specific detailed guidance has been given, and expenses are expected to revert close to 2016 levels by 2019, excluding legals.

Critically, even though the bank has guided unchanged revenues (conservative given the possibility of higher rates and increased non-interest income), expenses are guided to an aggressive $50-51bn in 2020, resulting in a large improvement in RoTE to 14-17% in 2 years and 17%+ beyond.

WFC Projected RoTE

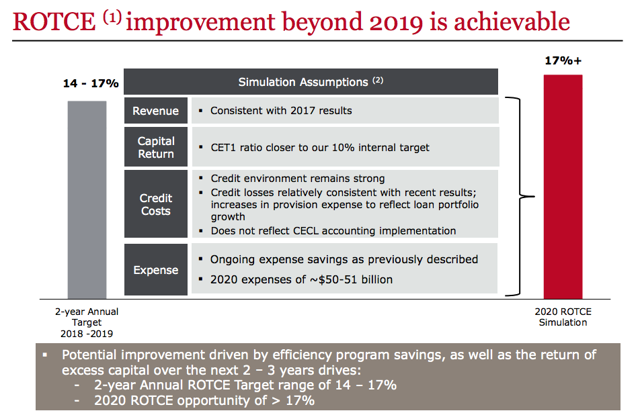
Source: Wells Fargo 2018 Investor Day Financial Overview

If this is realised (under the above conservative revenue guidance), using an excess return valuation framework, a stock price of 66.5 is attainable. We believe these assumptions are realistic absent a sustained rise in credit loss provisions and/or revelations of further material legal and/or reputational issues. Provisioning is something that needs watching at this point in the cycle given the very low level of provisions being made at this time.

The longer term and potentially bigger underlying problem that has not been as widely discussed is the lack of revenue growth. Wells Fargo is less exposed to investment banking and so has not benefited from the pickup in revenues that some of its peers saw in 2017 and Q1 2018. However, revenue growth has also lagged in its other businesses, not only versus its direct peers but also against purer play competitors such as U.S. Bancorp (NYSE:USB). All have managed to grow net interest and non-interest revenue in a way that Wells Fargo has not in recent months. This needs further investigation. Wells Fargo is becoming more cautious in business selection at this point in the cycle. Its riskier auto loan, credit card and junior lien mortgage exposure were the main sources of the decline in loans outstanding in Q1. Notwithstanding this, the lack of revenue growth may ultimately constrain valuation once the bank's efficiency ratio returns to its underlying level.

We are long-term holders of the stock since 2009. We would only be buyers of additional stock following material price weakness in the months ahead. This is on valuation grounds and on the basis that Wells Fargo's business model has not been permanently damaged, asset quality will not materially deteriorate in the short term and so its financial performance will return to its underlying trend. However, in the longer term, the lack of revenue growth is a concern and is something we will return to.

Disclosure: I am/we are long WFC, BAC, JPM, USB.

I wrote this article myself, and it expresses my own opinions. I am not receiving compensation for it (other than from Seeking Alpha). I have no business relationship with any company whose stock is mentioned in this article.

Additional disclosure: We invest in bank equity and bank capital securities on a long only basis where we see value.

Tuesday, May 22, 2018

Beasley Broadcast Group (BBGI) Director Mark S. Fowler Sells 5,505 Shares

Beasley Broadcast Group (NASDAQ:BBGI) Director Mark S. Fowler sold 5,505 shares of the company’s stock in a transaction dated Friday, May 18th. The stock was sold at an average price of $10.78, for a total value of $59,343.90. Following the sale, the director now owns 34,199 shares of the company’s stock, valued at $368,665.22. The sale was disclosed in a filing with the Securities & Exchange Commission, which is available through this hyperlink.

NASDAQ:BBGI remained flat at $$11.10 on Monday. The company’s stock had a trading volume of 4,138 shares, compared to its average volume of 13,631. The firm has a market capitalization of $305.26 million, a price-to-earnings ratio of 16.57 and a beta of 0.70. The company has a debt-to-equity ratio of 0.79, a current ratio of 2.30 and a quick ratio of 2.30. Beasley Broadcast Group has a 12 month low of $8.25 and a 12 month high of $14.40.

Get Beasley Broadcast Group alerts:

Beasley Broadcast Group (NASDAQ:BBGI) last announced its quarterly earnings results on Monday, May 7th. The company reported ($0.11) EPS for the quarter. The firm had revenue of $55.15 million for the quarter. Beasley Broadcast Group had a return on equity of 7.56% and a net margin of 32.74%.

Hedge funds and other institutional investors have recently modified their holdings of the company. ZPR Investment Management purchased a new stake in shares of Beasley Broadcast Group in the first quarter worth about $138,000. AXA boosted its position in shares of Beasley Broadcast Group by 113.6% in the fourth quarter. AXA now owns 25,011 shares of the company’s stock worth $335,000 after buying an additional 13,300 shares during the period. Bank of New York Mellon Corp purchased a new stake in shares of Beasley Broadcast Group in the fourth quarter worth about $543,000. BlackRock Inc. boosted its position in shares of Beasley Broadcast Group by 3.3% in the fourth quarter. BlackRock Inc. now owns 293,224 shares of the company’s stock worth $3,930,000 after buying an additional 9,410 shares during the period. Finally, Dimensional Fund Advisors LP boosted its position in shares of Beasley Broadcast Group by 2.2% in the third quarter. Dimensional Fund Advisors LP now owns 442,771 shares of the company’s stock worth $5,180,000 after buying an additional 9,723 shares during the period. 14.23% of the stock is owned by institutional investors.

Separately, BidaskClub lowered Beasley Broadcast Group from a “buy” rating to a “hold” rating in a research note on Saturday, May 12th.

About Beasley Broadcast Group

Beasley Broadcast Group, Inc, a radio broadcasting company, operates radio stations in the United States. As of February 12, 2018, it owned and operated 63 stations, including 45 FM and 18 AM stations in 15 large- and mid-size markets. The company was founded in 1961 and is headquartered in Naples, Florida.

Monday, May 21, 2018

4 Key Takeaways from Tencent's First Quarter

Tencent (NASDAQOTH:TCEHY) had plenty to prove during the first quarter, since its fourth-quarter report in March raised serious concerns about runaway spending and contracting margins. Yet the Chinese tech giant allayed those fears when it revealed its first-quarter numbers on May 16.

Tencent's total revenue rose�48% annually to 73.5 billion yuan ($11.7 billion), easily beating the consensus estimate of 70.8 billion yuan. Its gross margin dipped one percentage point annually to 50%, but still easily topped the consensus estimate of 47%. Its net profit jumped 65% to 24 billion yuan ($3.8 billion).

The Tencent Building in Shenzhen.

Image source: Tencent.

Its non-GAAP net profit attributable to shareholders -- which excludes certain noncash items and the impact of certain investments and acquisitions -- rose 29% annually to 18.3 billion yuan ($2.9 billion), or 1.92 yuan per diluted share. That missed the consensus estimate of 1.94 yuan per share, but the miss was easily offset by Tencent's robust revenue growth and better-than-expected margins.

Tencent's OTC shares jumped 7% after the report, while its Hong Kong-listed shares climbed 4% the following day. Let's examine the four biggest takeaways from Tencent's first-quarter report.

1. Transitioning from PC to mobile games

Tencent is the largest video game publisher in the world by annual revenue. Its most popular PC titles include esports classic League of Legends and the newer beat 'em up�DnF (Dungeon & Fighter).

It also owns a 40% stake in Epic Games, which publishes the hit game Fortnite Battle Royale. However, Tencent's PC gaming revenue stayed roughly flat year over year at 14.1 billion yuan ($2.2 billion), due to an ongoing market shift from PC titles to mobile gaming.

Its top mobile games include Honor of Kings (also known as Arena of Valor), QQ Speed Mobile, and the mobile versions of PlayerUnknown's Battlegrounds. Those titles helped boost its total mobile gaming revenue by 68% annually to 21.7 billion yuan ($3.4 billion), easily offsetting the slower growth of its PC games.

Tencent's Arena of Valor.

Tencent's "Arena of Valor." Image source: Google Play.

2. An expanding social ecosystem

Tencent's WeChat (also known as Weixin), the most popular mobile messaging app in China, grew its monthly active users (MAUs) 11% annually to 1.04 billion. Mobile MAUs for its older QQ messaging app rose 2% to 694 million. That growth offset an 11% decline in MAUs in its older Qzone social network, which still has 562 million MAUs.

That expanding social media presence is essential to its growth strategy, which centers on turning WeChat into an all-in-one "super app" for payments, ridesharing, deliveries, and e-commerce services that are integrated with a growing list of online and offline retail partners.

That expansion of WeChat complements Tencent's forays into other ad-supported markets like streaming video and streaming music. During the quarter, its total ad revenue rose 55% annually to 10.7 billion yuan ($1.7 billion) -- buoyed by 31% growth in media ad revenue (including 64% growth in video ads) and 69% growth in advertising revenue from its social media and other apps.

Tencent's total revenue from value-added services -- which includes nonadvertising revenue from its ecosystem transactions (like virtual gifts on social media, fees from certain services, and microtransactions in games) -- jumped 34% annually to 46.9 billion yuan ($7.4 billion).

3. Cloud and payments growth

Tencent's "other" revenue -- which mainly comes from its cloud platform, payments related services (WeChat Pay), and investments -- surged 111% to nearly 16 billion yuan ($2.5 billion). Tencent owns the second largest cloud platform in China after Alibaba (NYSE:BABA) Cloud, and it's been tethering a growing list of financial institutions and retailers to that platform. WeChat Pay is the second largest payments platform in China after the Alibaba-backed Alipay.

Tencent's main cloud strategy is to offer businesses integration with WeChat's massive user base, which enables Tencent to cross-sell analytics and security services. Tencent also tries to tether those businesses to WeChat Pay's financial ecosystem to counter Alipay.

Those two issues are at the center of the escalating battle between Tencent and Alibaba, which forced both companies to significantly boost spending in recent quarters.

4. Rising costs

However, all that growth comes at a price. Tencent's cost of revenue still rose 51% to 36.5 billion yuan ($5.7 billion) and outpaced its revenue growth rate. But that wasn't nearly as alarming as its 72% jump in costs during the fourth quarter.

The bottom line

Tencent's first-quarter numbers tell us three main things: Analysts' concerns about its high spending crushing its margins were mostly unfounded; its ecosystem continues to evolve as its social, gaming, and cloud businesses start overlapping; and it can maintain impressive revenue and earnings growth while widening its moat against rivals like Alibaba.

Sunday, May 20, 2018

#Consensus2018 Fails To Pump Up Bitcoin

&l;p&g;&l;img class=&q;dam-image shutterstock size-large wp-image-1054859525&q; src=&q;https://specials-images.forbesimg.com/dam/imageserve/1054859525/960x0.jpg?fit=scale&q; data-height=&q;640&q; data-width=&q;960&q;&g; #Consensus2018 Fails To Prop Up Bitcoin (Shutterstock)

CoinDesk&s;s Consensus 2018 &l;a href=&q;https://www.coindesk.com/events/consensus-2018/&q; target=&q;_blank&q;&g;conference&l;/a&g;&a;nbsp;is over and it failed to pump up cryptocurrencies.

Despite this conference, which, if you believe in my &l;a href=&q;https://www.forbes.com/sites/petertchir/2017/09/13/three-rules-of-bitcoin/#1cf9242218e8&q;&g;3 Rules of Bitcoin&l;/a&g;, was an ideal opportunity to hype cryptocurrencies and pump them higher, cryptocurrencies mostly fell this week.

Bloomberg reports that &l;a href=&q;https://www.bloomberg.com/news/articles/2018-05-18/crypto-wealth-sinks-52-billion-in-week-of-lambos-yachts-snoop&q; target=&q;_blank&q;&g;Crypto Wealth&l;/a&g; declined&a;nbsp;$45 billion in one week.&a;nbsp; Bitcoin dropped.&a;nbsp; Ripple dropped.&a;nbsp; Ethereum dropped.&a;nbsp; Litecoin dropped.&a;nbsp; The inability for the enthusiasm of the conference participants (and their twitter accounts) failed to translate into any price gains.

I continue to believe that price of crypto is driven largely by the rate of new adoption (with periodic support from miners and extremely large holders who have the most incentive to prop up&a;nbsp;prices - again, see my 3 rules of Bitcoin).

The fact that this conference, where the hashtag #Consensus2018 dominated social media feeds on twitter could not get crypto prices to pop should send a disturbing message to current holders.

&l;strong&g;In theory, the hype surrounding this conference should have attracted a lot of new users and pushed prices higher&l;/strong&g; (nothing like the Thanksgiving/Futures rally, but some strong support).

&l;strong&g;Instead, the conference has a bit of the feel of a bunch of people patting themselves on the back, declaring victory, not realizing fewer people care.&l;/strong&g;

&l;!--nextpage--&g; While many of the biggest supporters are out there saying not to worry about the lack of a #Consensus2018 bump - I think you should be worried enough to sell at least some of your stake here (if you have any).

While Bill Gates might not be able to short bitcoin - you could take a shot - on small size, in the futures market.

&a;nbsp;&l;/p&g;